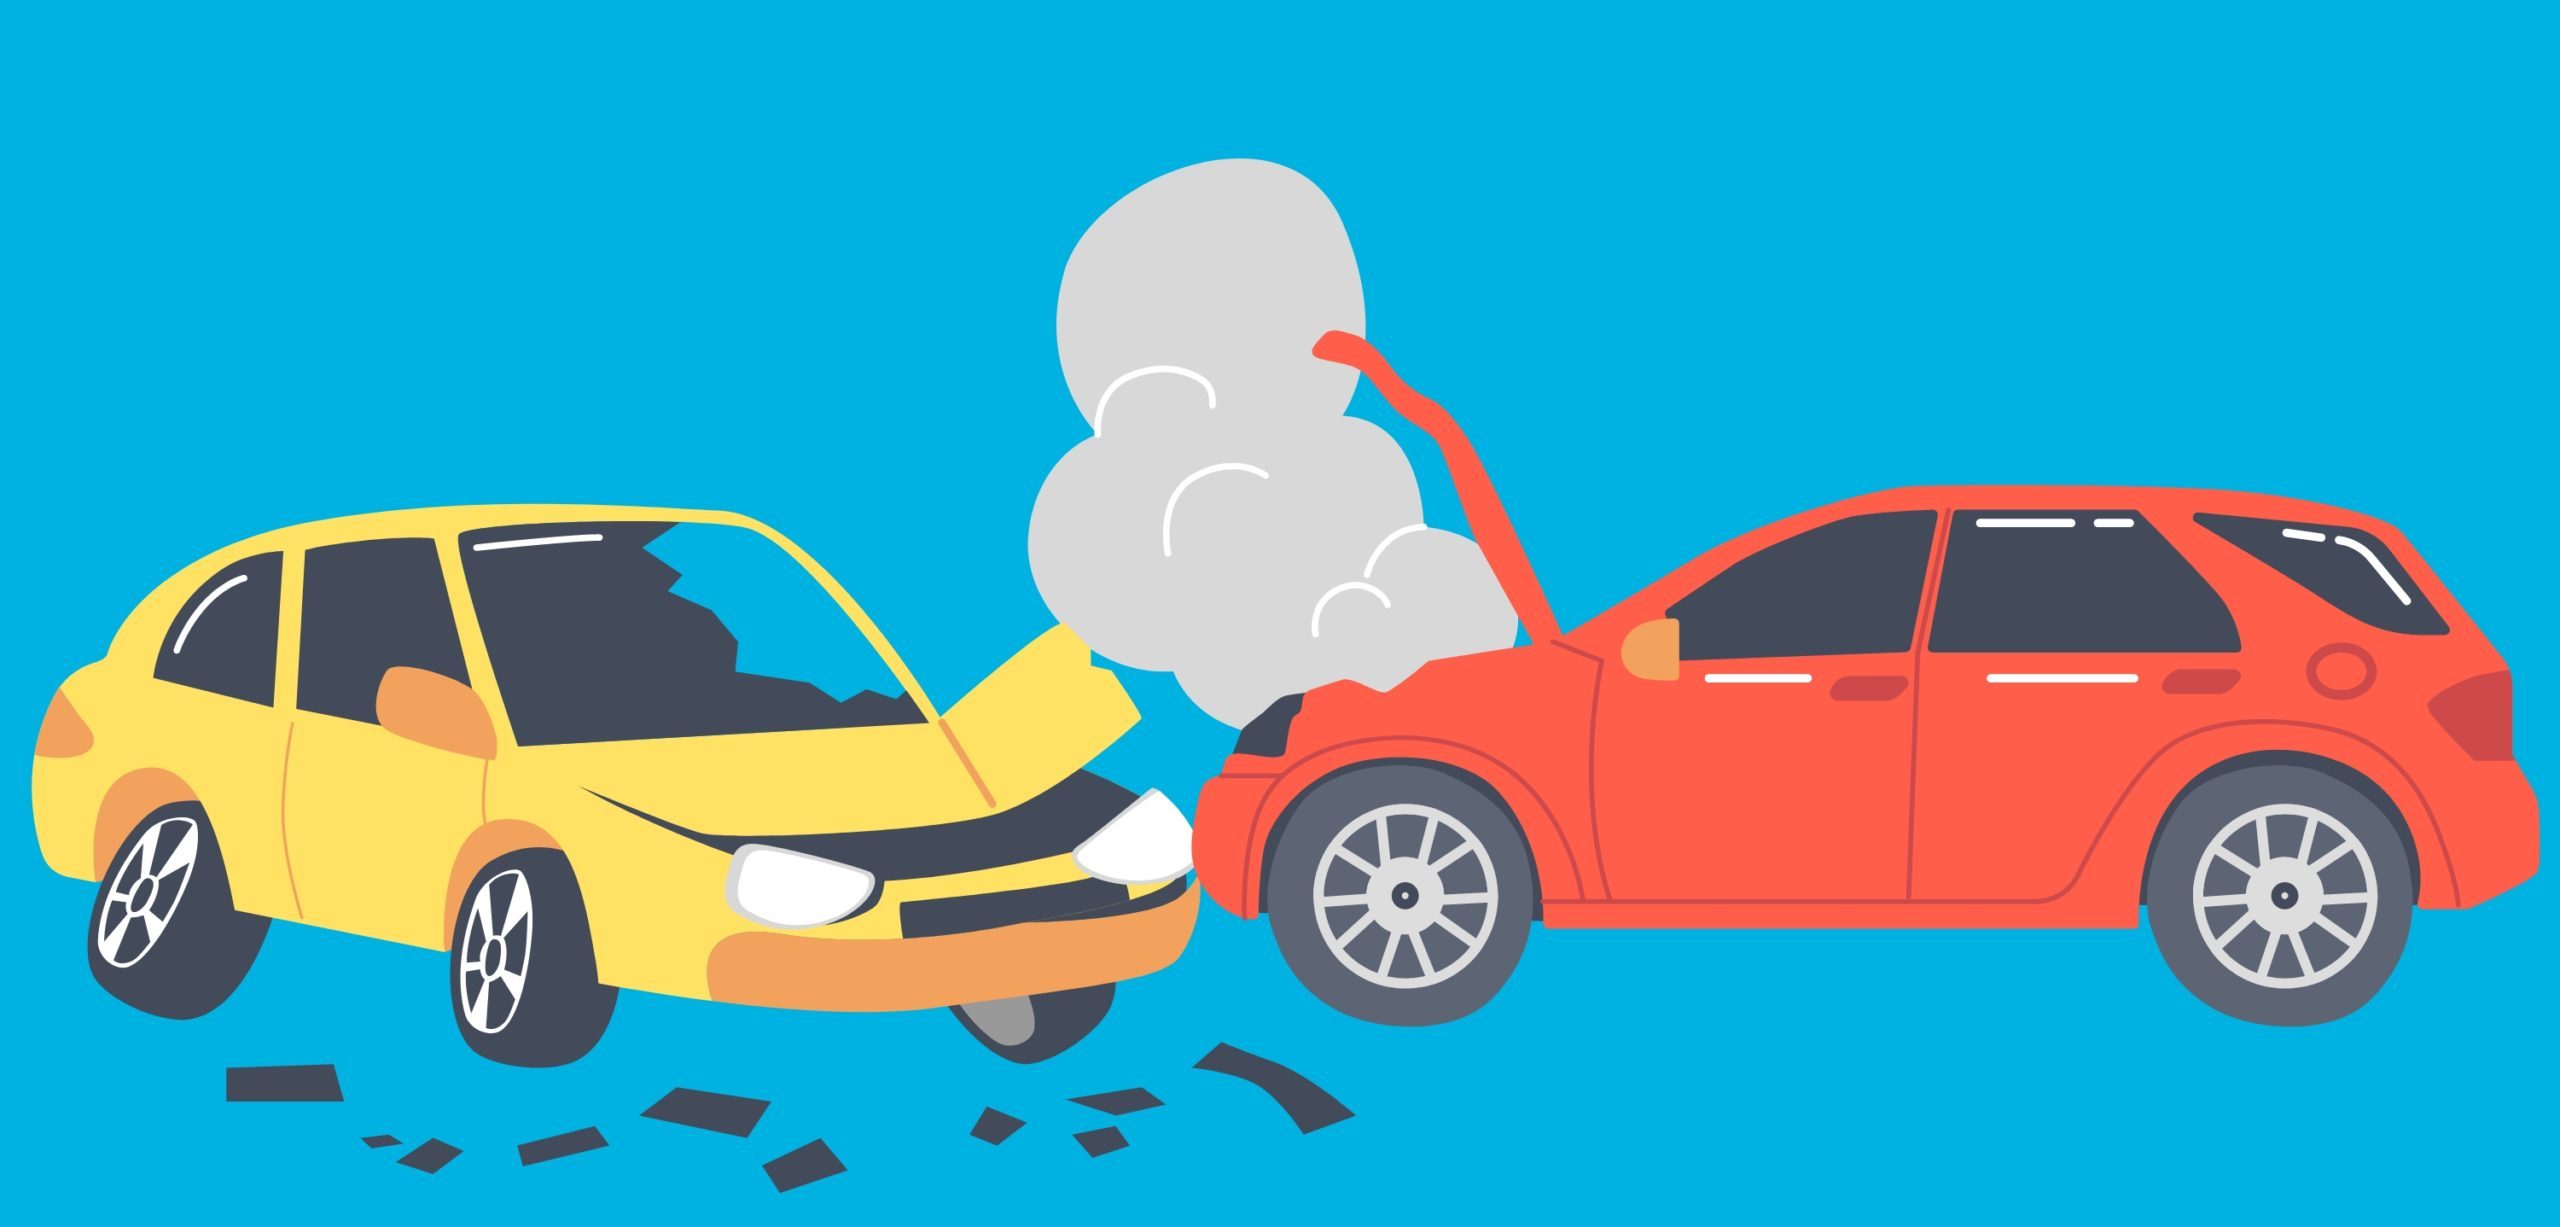
A new report released by Nimblefins, using statistics from the Department for Transport, has uncovered the leading causes of collisions on UK roads. It comes as no surprise to us at IAM RoadSmart that driver error is the cause in the vast majority of cases.
Factors like improper observation, anticipation, and planning, as well as failure to understand the environment in which they’re driving led to thousands of collisions in 2022.
As a fleet manager, your job is to safeguard the safety of your drivers. By using any of our fleet risk management or driver safety services, you can enhance your fleet safety and protect your organisation, as well as lift the standard of safety across UK roads.
For example, Driving for Work – our flagship on-road training course for business drivers – can help them develop an enhanced ability to anticipate hazards on the road, which could significantly improve their ability to predict and avoid danger.
Unveiling the top 10 causes of collisions
Drivers or riders failing to look properly is the single most common cause of collisions in Great Britain, contributing to 37.8% of incidents: a total of 22,671.
The next most common factor is a driver or rider failing to judge another person’s path or speed, this contributes to causing another 19.7% of incidents.
Driver or rider being careless, reckless or in a hurry (18% of accidents).
You’ll notice that the percentages in the table below add up to more than 100%—this is because many car accidents have multiple contributory factors.
| 10 Most Common Car Accident Causes in Great Britain | Number | Percent | |
|---|---|---|---|
| 1 | Driver/Rider failed to look properly | 22,671 | 37.8% |
| 2 | Driver/Rider failed to judge other person’s path or speed | 11,807 | 19.7% |
| 3 | Driver/Rider careless, reckless or in a hurry | 10,806 | 18.0% |
| 4 | Poor turn or manoeuvre | 6,945 | 11.6% |
| 5 | Loss of control | 6,832 | 11.4% |
| 6 | Slippery road (due to weather) | 4,871 | 8.1% |
| 7 | Exceeding speed limit | 4,457 | 7.4% |
| 8 | Pedestrian failed to look properly | 4,027 | 6.7% |
| 9 | Travelling too fast for conditions | 3,744 | 6.2% |
| 10 | Sudden braking | 2,836 | 4.7% |
| Total number of accidents | 59,980 | ||
Combined Factors
Many incidents have multiple contributory factors – for example, a driver in a hurry might fail to look properly – a case like this would have two contributory factors: Driver/Rider failed to look properly” and “Driver/Rider failed to judge other person’s path or speed” – in fact, this combination of factors accounted for 5,164 collisions in 2022.
| Most common pairs of contributory factors reported together | Number | Percent | |
|---|---|---|---|
| Driver/Rider failed to look properly | Driver/Rider failed to judge other person’s path or speed | 5,164 | 4.7% |
| Driver/Rider failed to look properly | Driver/Rider careless, reckless or in a hurry | 3,150 | 2.9% |
| Poor turn or manoeuvre | Driver/Rider failed to look properly | 2,594 | 2.3% |
| Driver/Rider failed to judge other person’s path or speed | Driver/Rider careless, reckless or in a hurry | 1,525 | 1.4% |
| Exceeding speed limit | Driver/Rider careless, reckless or in a hurry | 1,444 | 1.3% |
| Poor turn or manoeuvre | Driver/Rider failed to judge other person’s path or speed | 1,299 | 1.2% |
| Loss of control | Driver/Rider careless, reckless or in a hurry | 1,236 | 1.1% |
| Slippery road (due to weather) | Loss of control | 1,133 | 1.0% |
| Poor turn or manoeuvre | Driver/Rider careless, reckless or in a hurry | 1,105 | 1.0% |
| Aggressive driving | Driver/Rider careless, reckless or in a hurry | 1,044 | 0.9% |
Source: Department for Transport.
Get in touch to find out how you can enhance safety and wellbeing in your fleet.
